
This will be a small blog post showing how altering a segment to use the keep buffer pool led to the exact opposite of the desired outcome (which was: having the object permanently cached without any need of physical disk reads).
How it started:
- Customer complained about bad performance
- Monitoring graph showing high usage of the disk where the data resides (almost 100% continuously)

For a systematic troubleshooting approach, we installed our own simulator of Oracle’s ASH (Active Session History), as this was a standard edition database. Built-In ASH is an Enterprise Edition feature and part of the Diagnostics Pack. Various open-source ASH simulators can be found online.
After installing and starting our simulated ASH, we let it collect some data for a couple of minutes and then started to mine its recorded data.
First step: Checking the wait events
- 75% of the overall DB-Workload were direct path reads
- The rest was more or less CPU
- That fits into the picture the monitoring graph already showed us
Second step: Which statements are causing the direct path reads?
- Now the ASH data was filtered to select only the samples where the event was “direct path read” and grouped by SQL_ID
- The output didn’t show any obvious culprit (hundreds of SQLs contributed to that event in about the same amount)
Third step: Group by force_matching_signature or plan_hash_value
- We now saw that ~99% of all direct path reads were generated by the same FORCE_MATCHING_SIGNATURE
- The application just didn’t use binds, so they ended up das different SQL_IDs and all of them shared the same execution plan
After these first insights we were looking at one of the statements and its execution plan. There was one FULL TABLE SCAN involved in the plan, which caused the direct path reads. But to our surprise this wasn’t a big table at all (just 4MB in size) and the query itself showed clear OLTP characteristics (high execution numbers, low number of rows processed, …). So nothing, where you’d usually expect to see direct path reads.
So why did Oracle choose to bypass the buffer cache for this table?
To answer that we started a combined SQL (Event 10046) and NSMTIO Trace on the affected table and compared it to a slightly larger table where Oracle opted to go for buffered reads. We just used a “select count(*)” on both tables and hinted to force an FTS.
Details about NSMTIO Traces can be found here and here and here.
Trace of the “direct path read” table
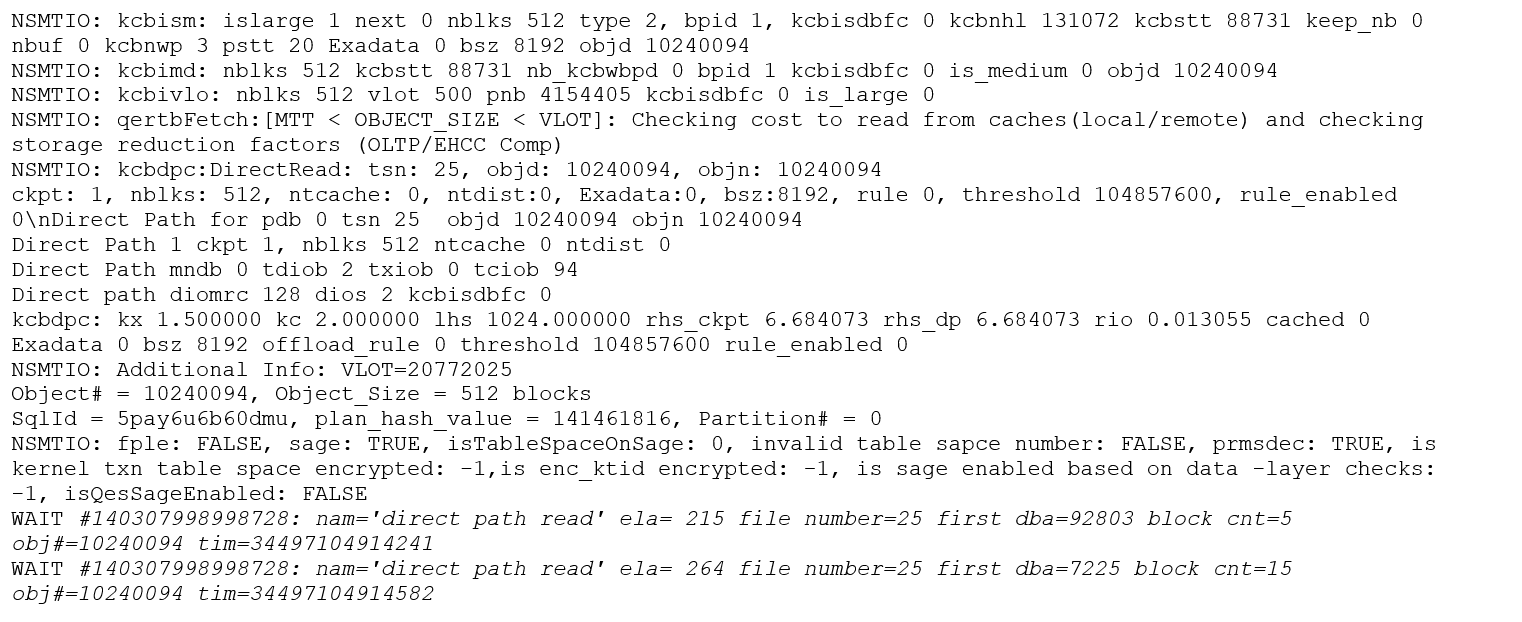
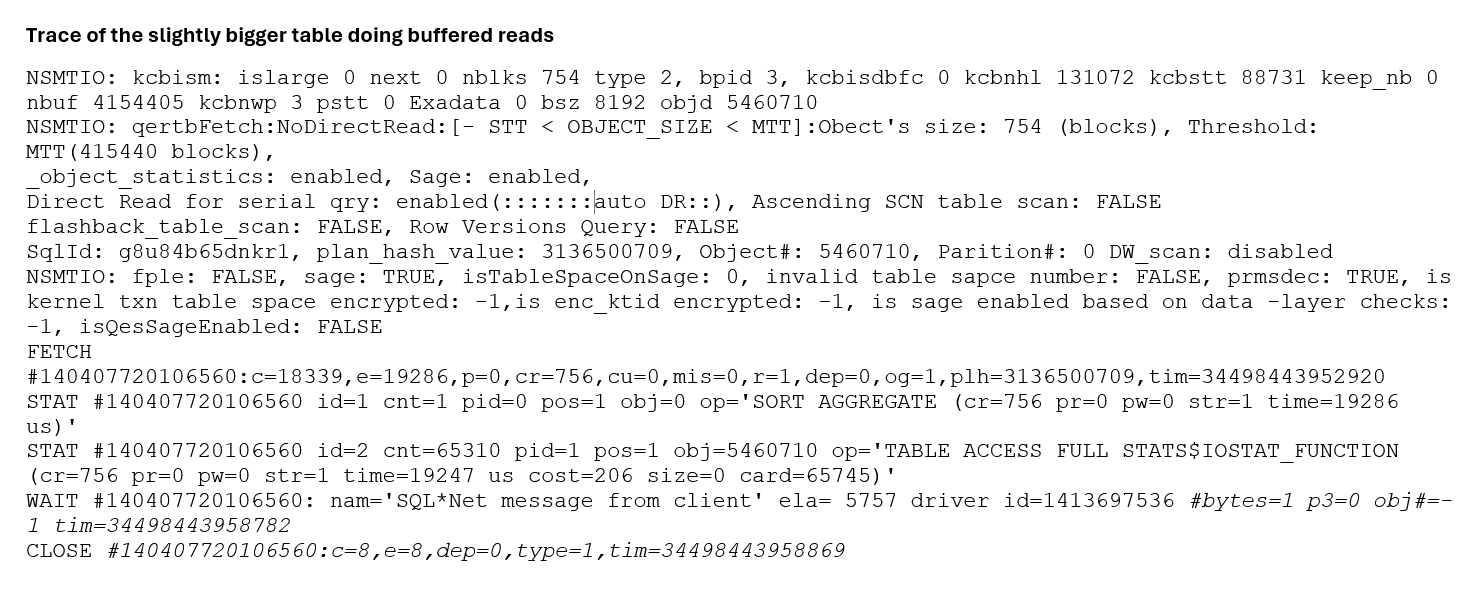
It took us a while to understand why direct path reads were chosen on the first tracefile, as the small table threshold was reported with 88731 (blocks) while the segment’s size is only 512 blocks. Nonetheless the table was categorized between being Medium-Sized and the VLOT boundary (:[MTT < OBJECT_SIZE < VLOT]:)).
After comparing the two traces two things in the “direct path read” tracefile caught our attention:
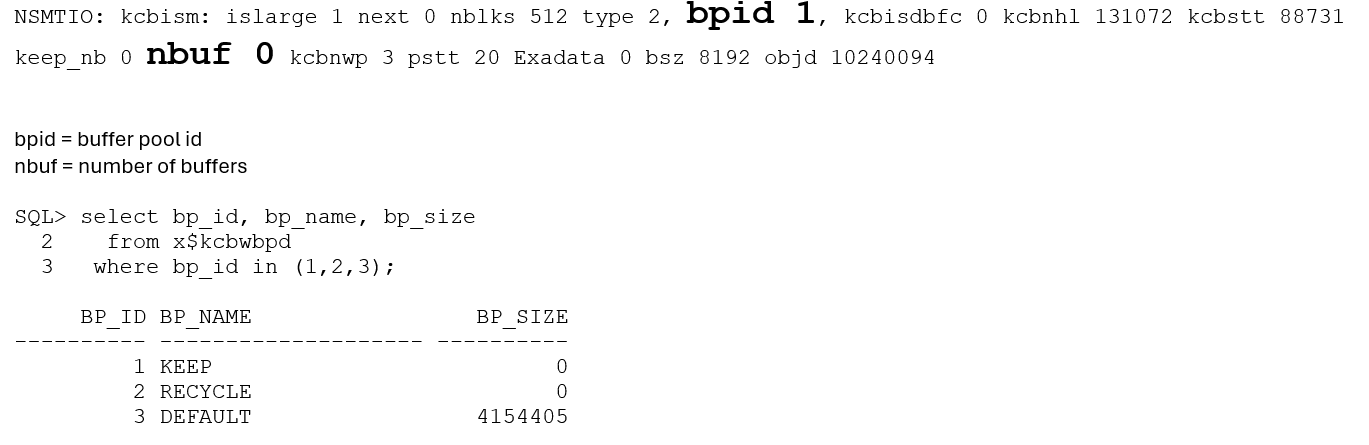
The table was altered to use the keep buffer pool, without telling a DBA to enable it (db_keep_cache_size = 0). So, there was no chance of a buffered read (where would the buffer go?) and therefore direct path reads were the only remaining option.
After putting it back to the default pool, the disk usage immediately dropped, performance went back to good and the customer was happy again!

Moral of the story: Before trying to use certain DB-features, let your DBA enable them first