Introduction to Oracle Automatic Workload Respository
In 2003 when Oracle Database 10.1 was released Oracle added Automatic Manageability Features for the first time.
Database administrators and internal database advisor tools need a lot of solid data to answer performance-related questions. Until then only external tools were available to record the data of an “Oracle black-box”
The Automatic Workload Repository (AWR) is built-in to every Oracle database collecting data automatically and inside the database.
Database engine and AWR share the same base-data. It will be used by the database itself even if you are not using it. It is just there.
Having such an in-depth access to the database using AWR is a good choice to give in-depth information of what is going on inside your database.
The easiest way to investigate performance-related issues is by using graphical representations of data. You should use tools like Oracle Grid Control or Oracle Enterprise Manager Console (EM Express) to analyse the data. It is just a few clicks and you are done.
However, sometimes you need advanced functionality, portability or might have no access to these web-interfaces.
This is the right time to take a closer look at the AWR Scripts which can be found in each Oracle Home.
Oracle AWR Licensing
Before I am showing you more details, we need to make sure you are not committing a license break. Even your database uses this data internally you are might not be allowed to use/query it too.
AWR is such a great feature built into the database you are only allowed to use it if you own “Diagnostic Pack” which is only available for “Enterprise Edition “.
The limitation even prohibits the usage of various sql-scripts like ORACLE_HOME/rdbms/admin/awr*.sql
Are you allowed to use Automatic Workload Repository?
You cannot tell it for sure without knowing exactly what Licenses were bought. Ask your company’s license administrator if Enterprise Edition and Diagnostic Pack was bought?
CAUTION: It is technically possible to install and use all options even you are not allowed to do so.
However, there are some small clues when you may not use it (do not use it for sure)
Your installed database edition is not Enterprise Edition
It is easy for unwary dbas to install enterprise edition even if the company paid for Standard Edition only. If you see your edition is something different than Enterprise Edition, it was very likely installed on purpose.

Parameter: control_management_pack_access is disabled
This Parameter was invented in 11g to users from causing an accidental unwanted license break. An all non-Enterprise Editions this Parameter is set to NONE by default.
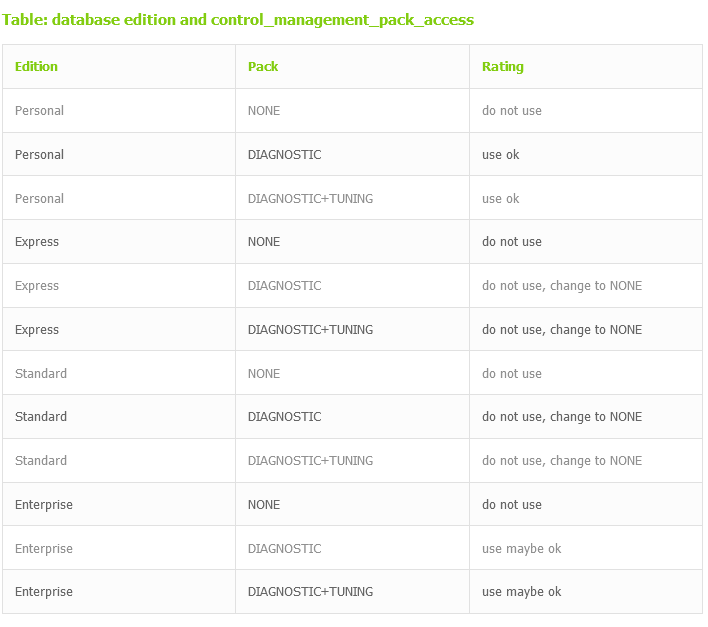
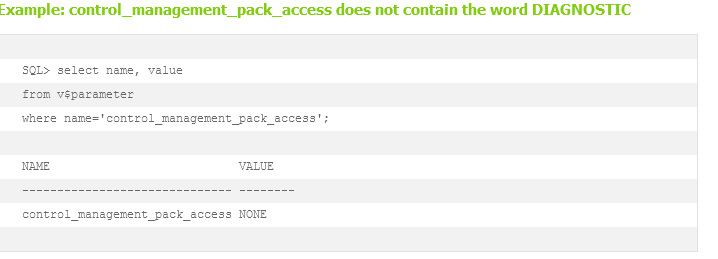
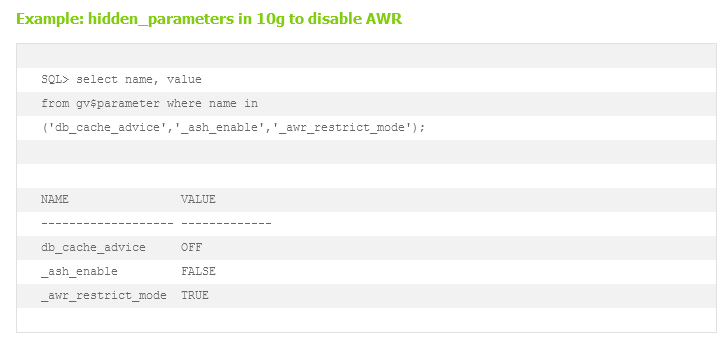
Pitfall: In 10g it was even easier to install the wrong edition and there is no parameter control_management_pack_access. Be careful using it there.
Oracle Statspack
If you cannot afford to buy Diagnostic Pack I strongly recommend configuring and install the free and dusty alternative STATSPACK (I will write about this next)
Sure, it is not a full replacement to AWR but when “we are adjusting the sails” we need to know the winds direction, don’t we? Statspacks runs on instance level (I will explain this later) and still works on 19c, RAC and PDB.
If you miss the nice graphics you must write you own data-parser, use excel or Toad > DBAdmin > Statspack Browser
Gaphical User interface (CloudControl & EM Express)
Since the first AWR tools were invented it is possible to use a limited set of tasks over a Graphical User Interface.
Oracle Enterprise Manger Express is a very limited management homepage running inside your database. The very limited options you are seeing here will be restricted further depending on database version and licenses. In general, it is more a nice dashboard than administration interface. It is just a start page linking to Performance Hub Active Report (perfhubrpt.sql). If you need usable performance reports, you should better switch to CloudControl or AWR Scripts.
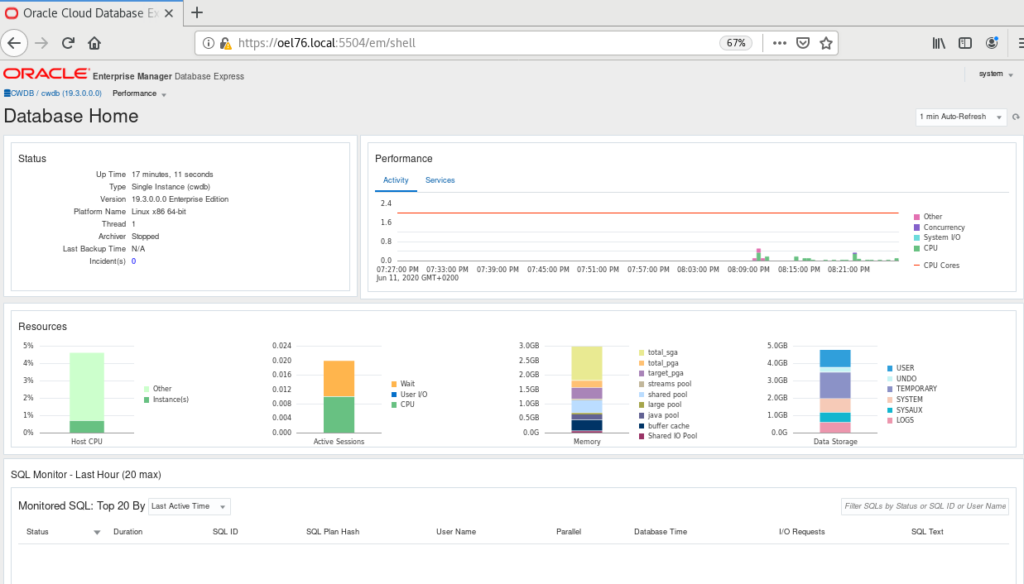
Image: EM Express: Performance Menu Options in 12c
Oracle EM Express
Performance Menu Options
Image EM Express: Performance Menu Options in 19c

Yes, it is just one option here.
All those features available in 12c EM Express are still available in 19c but the quick links are remove. You can reach them implicitly when investigation a single issue or sql-statement.
Image: EM Express: Performance > Performance Hub
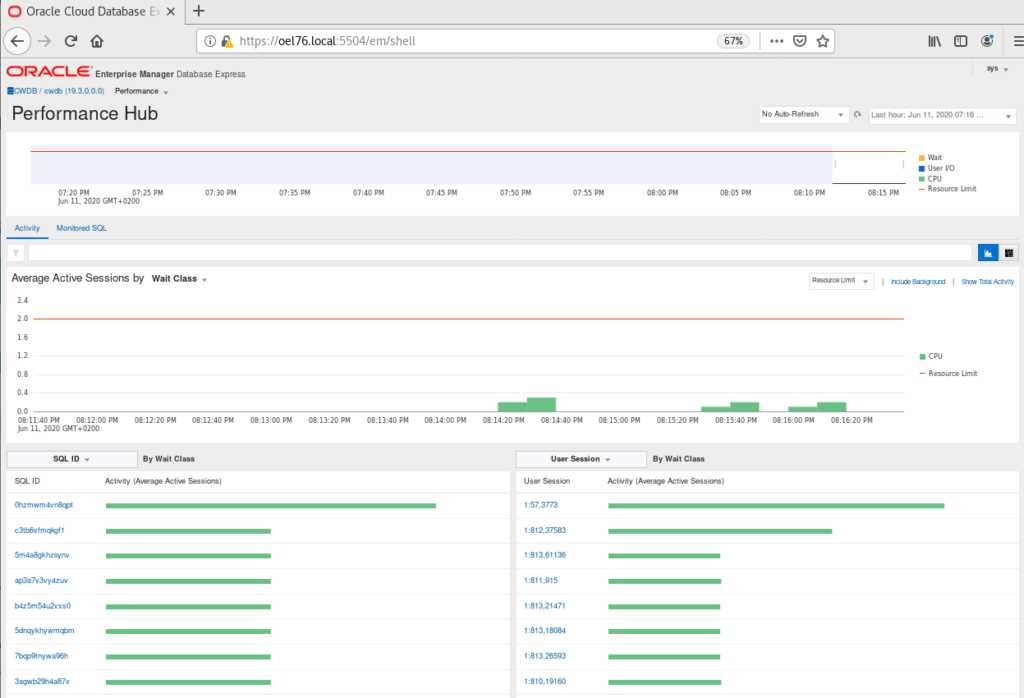
Performance Hub > This is the only performance related view you can get on EM Express. It looks very similar to Performance Hub Active Report (perfhubrpt.sql) but you have to option to „move“ the timeframe slider and switch to „monitored SQL“ with just a click.
Performance Hub > Activity – See history of sessions limited to local instance. Depending on configuration you will see almost all sessions causing load on database.
Performance Hub > Monitored SQL – Use it to look at the current running database and see some performance numbers. You may even investigate SQL issues a little.
CloudControl
The CloudControl should be used by enterprise customers who want to monitor and store more than one database. If you own the licenses you get more clickable options than in EM Express.
You get links to a lot of tools, advisors and configuration wizards. There is no need to switch to SQLPlus or command line for the most tasks.
Image: CloudControl: Performance Menu Options > Performance Home
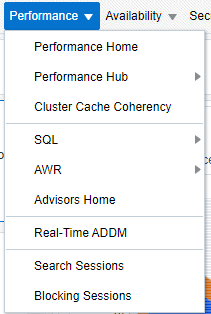
Performance-Home – default dashboard to see what is going on. Same as on EM Express but gives you cluster-wide views.
Performance Hub – Same as on EM Express. You could even get it on command line as shown in: Performance Hub Active Report (perfhubrpt.sql) All tools here help you to narrow down issues fast without really digging too much into details. Most of the time one single statement is causing the problem.
Cluster Cache Coherency – Cluster related performance indicators as tabular or graphical-view (still needs flash)
SQL – a lot of SQL related tools and options (see next screenshot)
AWR – some Automatic Workload Repository related tasks (see next screenshot)
Advisors Home – quick link to database advisors. Suggesting possible solutions to past issues found using AWR or ASH
Real-Time ADDM – Automatic Database Diagnostic Monitor. Suggests possible solutions to tasks currently running.
Search Sessions – find a specific active session
Blocking Sessions – analyse blocking tree and kill blocking sessions
Image: CloudControl: Performance Menu Options > Performance Hub
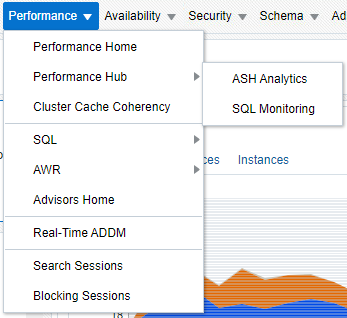
Performance Hub > ActiveSessionHistory Analytics – is called Activity in EM Express to see history of sessions. This page even works on cluster-wide databases not just on single instances. Depending on configuration you will see almost all sessions causing load on database.
Performance Hub > SQL Monitoring – dig into the performance of a specific sql statement done in the past. The option is named Monitored SQL in EM Express
Image: CloudControl: Performance Menu Options > SQL
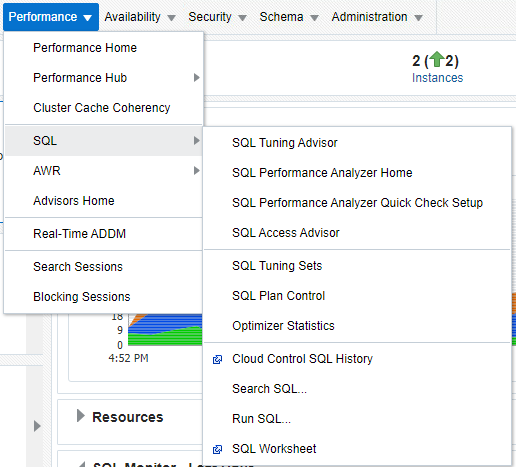
SQL > SQL Tuning Advisor – SQL optimisation suggestions
SQL > SQL Performance Analyzer (SPA) Home – analyse change impacts (whatif)
SQL > SQL Performance Analyzer (SPA) Quick Check Setup – ad hoc check
SQL > SQL Access Advisor – data access plans
SQL > SQL Tuning Sets – for SQL tuning advisor
SQL > SQL Plan Control – SQL Profiles and SQL Plan Baselines (execution hints)
SQL > Optimizer Statistics – Statistics gathering auto tasks
SQL > Cloud Control SQL History – find top statements, enable tracing
SQL > Search SQL – find SQL by various conditions in cursor cache, AWR snapshots, AWR baselines, SQL tuning sets (STS)
SQL > Run SQL – run a single SQL-statement as you would do from SQLDeveloper
SQL > SQL Worksheet – like „run SQL“ but with some execution options
The SQL related tools are a lot more than you can get from EM Express. Everything you need to handle SQLs using Diagnostic and Tuning Pack.
The SQL related tools are a lot more than you can get from EM Express. Everything you need to handle SQLs using Diagnostic and Tuning Pack.
Image: CloudControl: Performance Menu Options: AWR
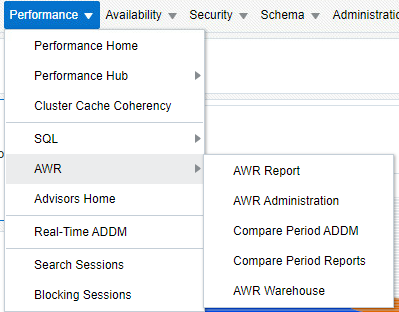
AWR Reports – Automatic Workload Repository Reports. See AWR Scripts for example outputs.
AWR Configuration – Automatic Workload Repository Reports Configuration. I will do this on command line in Configuration
AWR Report Comparison – Compare Reports of different times, instances and/or databases. See AWR Scripts for example outputs.
All AWR tasks besides AWR-Warehouse can be accomplished on command line too. I will cover the AWR part later in AWR Scripts section.
The CloudControl has a lot more options than EM Express but you must use AWR Scripts if you:
… cannot access the EM Express / CloudControl homepage
… need more options than available in EM Express
… need to store AWR data externally
… want to compare AWR reports of different databases / instances
Configuration
If you continue with these steps, you should better already know if you are allowed by license to do so.
The Automatic Workload Repository is installed and available since Oracle 10.1. It comes preconfigured with best-practice-defaults and will be used by the database internally. This configuration is enough to get “some data” for the AWR reports I am showing you later in this article. I suggest doing small adjustments to before using it extensively.
Time and Space matters
By default, the so-called database “snapshots” are made every hour. It might be even a good idea to increase the interval to every 15 minutes to sharpen the focus. The snapshots are stored in the AWR for 8 days by default after which they are automatically purged.
Oracle estimates its space for an average single instance snapshotting every 1 hour and keeping it for 8 days round about 300MB. Use this as minimum. I have seen bigger values in practice.
Example: AWR Size of a bigger database
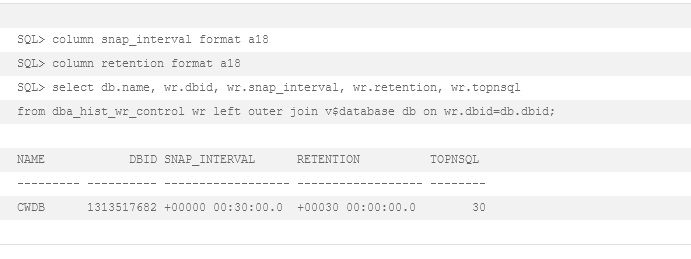
modify AWR snapshot settings
It is possible to change these settings using CloudControl > Performance > AWR > AWR Configuration or you can modify the AWR settings using the Package DBMS_WORKLOAD_REPOSITORY like this:
Example: modify snapshot settings using dbms_workload_repository
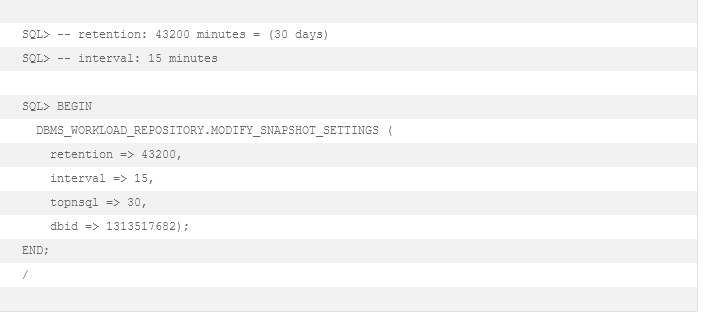
A snapshot is a picture of a specific point-in-time. You get a lot of data which helps you to see what is going on, but you will not get everything.
Tip: We recommend setting the interval not smaller than 15 minutes. In most cases this is a good size. Lower intervals take up more performance and space.
Limit snapshot scope
The Parameter STATISTICS_LEVEL defines the granularity and scope of data to be collected on each snapshot.
Possible values are:
Table: possible statistics_level values

Example: show configured statistics_level parameter

Tip: We recommend leaving this parameter on its default value TYPICAL.
Example: change parameter statistics_level

dba_hist_snapshot (list AWR snapshots)
This is the base-table which contains the overview-information of all available snapshots. You will see a similar output later when using the AWR scripts.
Pitfall: All queries o DBA_HIST_* tables require Enterprise Edition and Diagnostic Pack License. Do not query if you do not own it.
Example: dba_hist_snapshot output
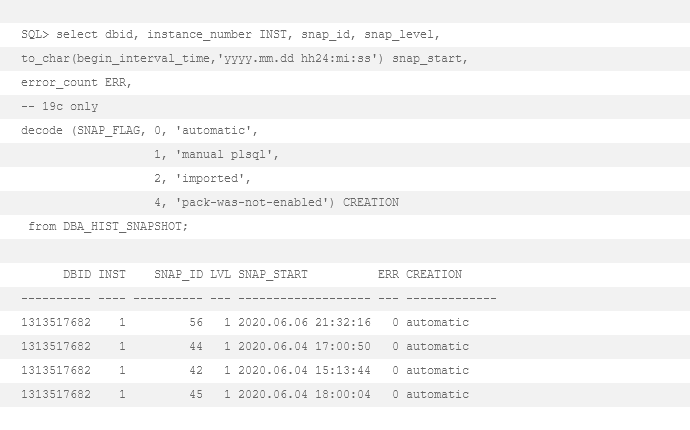
Columns explained
SNAP_LEVEL – Parameter STATISTICS_LEVEL when snap was taken. 1 = TYPICAL 2 = ALL
Tip: Do not mix it up with STATSPACK levels (1-19)
ERROR_COUNT – this is new in 19c. Reporting will still work with minor glitches or missing information.
SNAP_FLAG – this in new in 19c. It shows how data was collected.
Create AWR snapshot
If you cannot wait until the snapshots create themselves, you may create them manually:


